
PHP Debug VSCode MAC
In this tutorial, we will look at installing and utilizing a debugger for your PHP scripts in a localhost environment.
Determine PHP Version
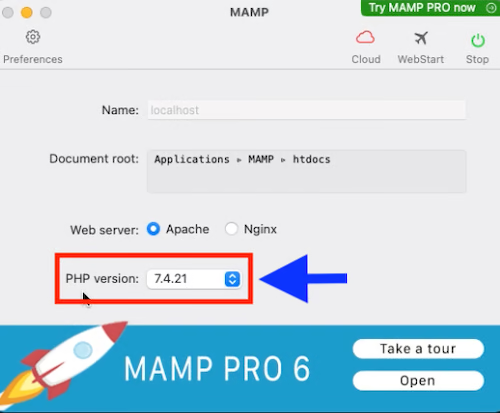
We need to determine the PHP version our MAMP local server has installed.
Different methods can determine this information.
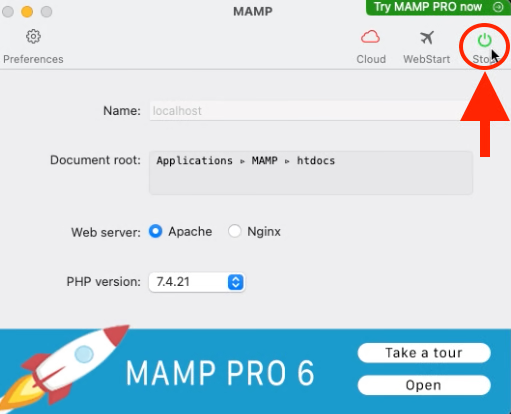
For simplicity, open your MAMP app default launch window. At the bottom of that window, you will see the PHP version MAMP runs. In my instance, I am running 7.4.21
Is XDebug pre-installed with MAMP?
Yes, XDebug comes pre-installed with MAMP. All we need to do is enable it.
To set breakpoints in VS Code and follow your PHP code execution, follow these steps.
Edit two configuration files
When you install MAMP, you, at the same token, download specific MAMP configuration folders in your filesystem. Two configuration files need editing to enable XDebug.
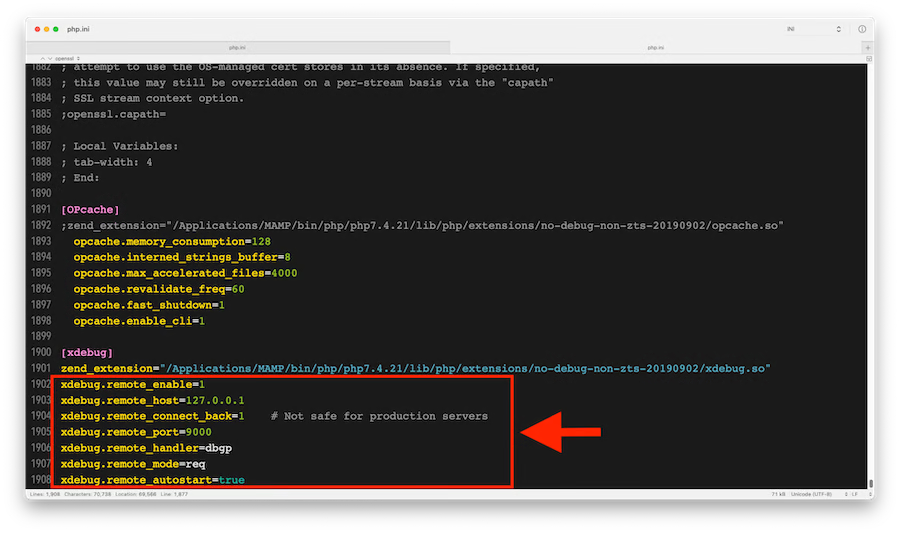
File 1: /Applications/MAMP/conf/php[version]/php.ini
First, uncomment the code below by removing the semi-colon at the beginning.
zend_extension="/Applications/MAMP/bin/php/php[version]/lib/php/extensions/no-debug-non-zts-20190902/xdebug.so"Then, add the following lines of code to this file at the very bottom, I.e., right underneath [xdebug].
xdebug.remote_enable=1
xdebug.remote_host=127.0.0.1
xdebug.remote_connect_back=1  # Not safe for production servers
xdebug.remote_port=9000
xdebug.remote_handler=dbgp
xdebug.remote_mode=req
xdebug.remote_autostart=true
Save and exit.
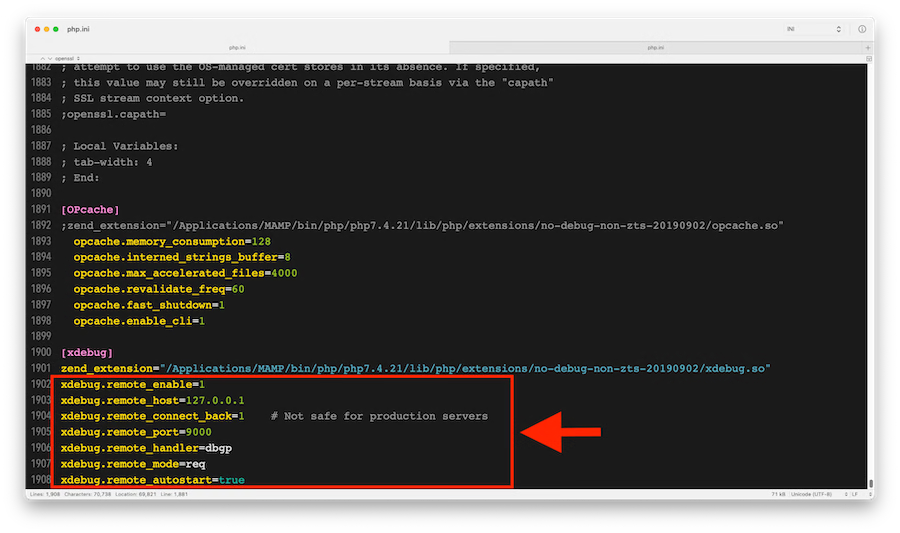
File 2: /Applications/MAMP/bin/php[version]/conf/php.ini
First, uncomment the code below by removing the semi-colon at the beginning.
zend_extension="/Applications/MAMP/bin/php/php[version]/lib/php/extensions/no-debug-non-zts-20190902/xdebug.so"Then, add the following lines of code to this file at the very bottom, I.e., right underneath [xdebug].
xdebug.remote_enable=1
xdebug.remote_host=127.0.0.1
xdebug.remote_connect_back=1  # Not safe for production servers
xdebug.remote_port=9000
xdebug.remote_handler=dbgp
xdebug.remote_mode=req
xdebug.remote_autostart=true
Save and exit.
Note:, XDebug is configured to run on port 9000.
Restart your MAMP localhost server
For the updated MAMP configuration files to take effect, you must restart your MAMP localhost server.
To do so, click on the default MAMP window and click the upper right icon twice. This stops and restarts the localhost MAMP server.
Setting up VS Code to Debug PHP
Install PHP Debug extension for VS Code
- Open VS Code.
- Go to the left Extensions icon located at the left navigation.
- Search "PHP Debug" in the extensions marketplace.
- Enable the extension
- Close and relaunch VS Code
Trigger configuration steps
Go to the directory at the location where a PHP script is present.
Make sure the PHP script is in the localhost server file system.
The file system will be located at:
/Applications/MAMP/htdocs/in macOS.
To open a folder in VS Code, go to File (top nav) > Open.
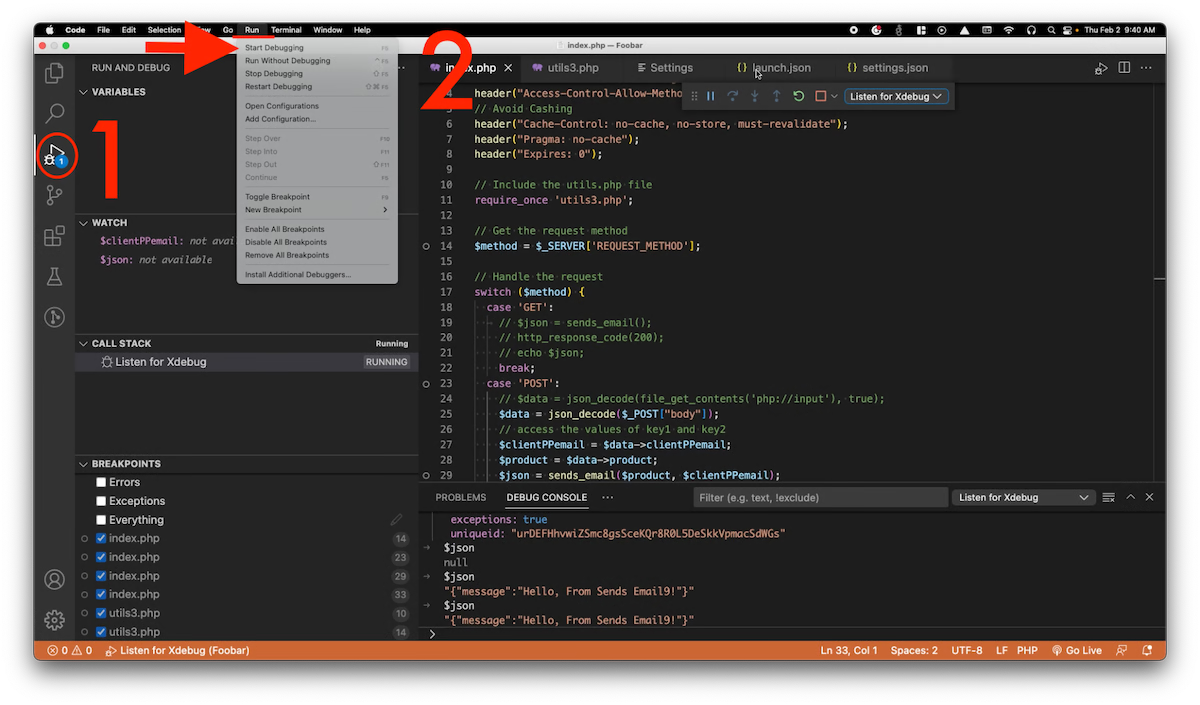
To debug on VSCode, you can go ahead and click the icon depicting a play and bug on the left navigation.
Click RUN top tab > Start Debugging.
Set the launch.json file
If this is the first time you try to run your debugger, VS Code will request that you create and set a launch.json configuration file.
You can do so by clicking positive for that request.
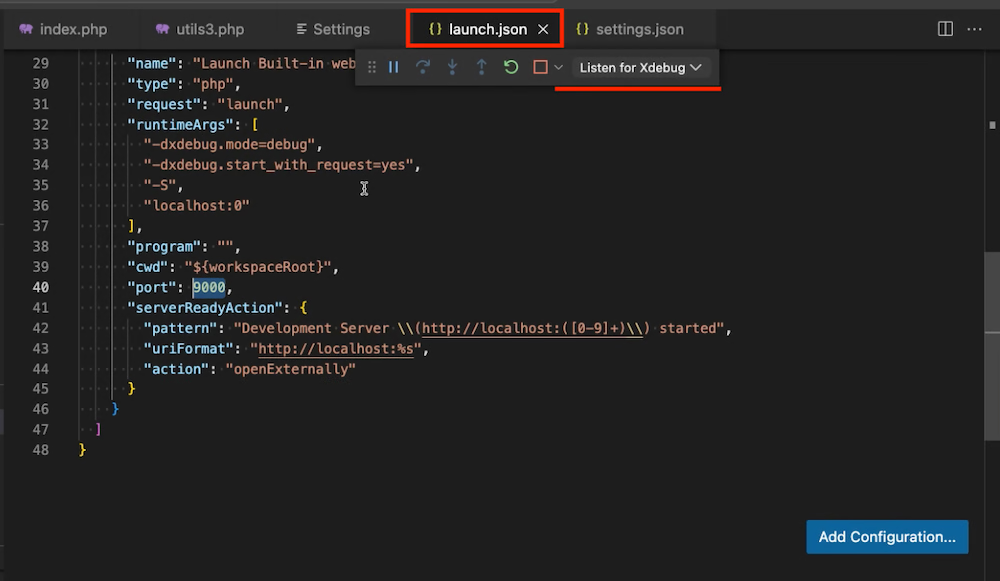
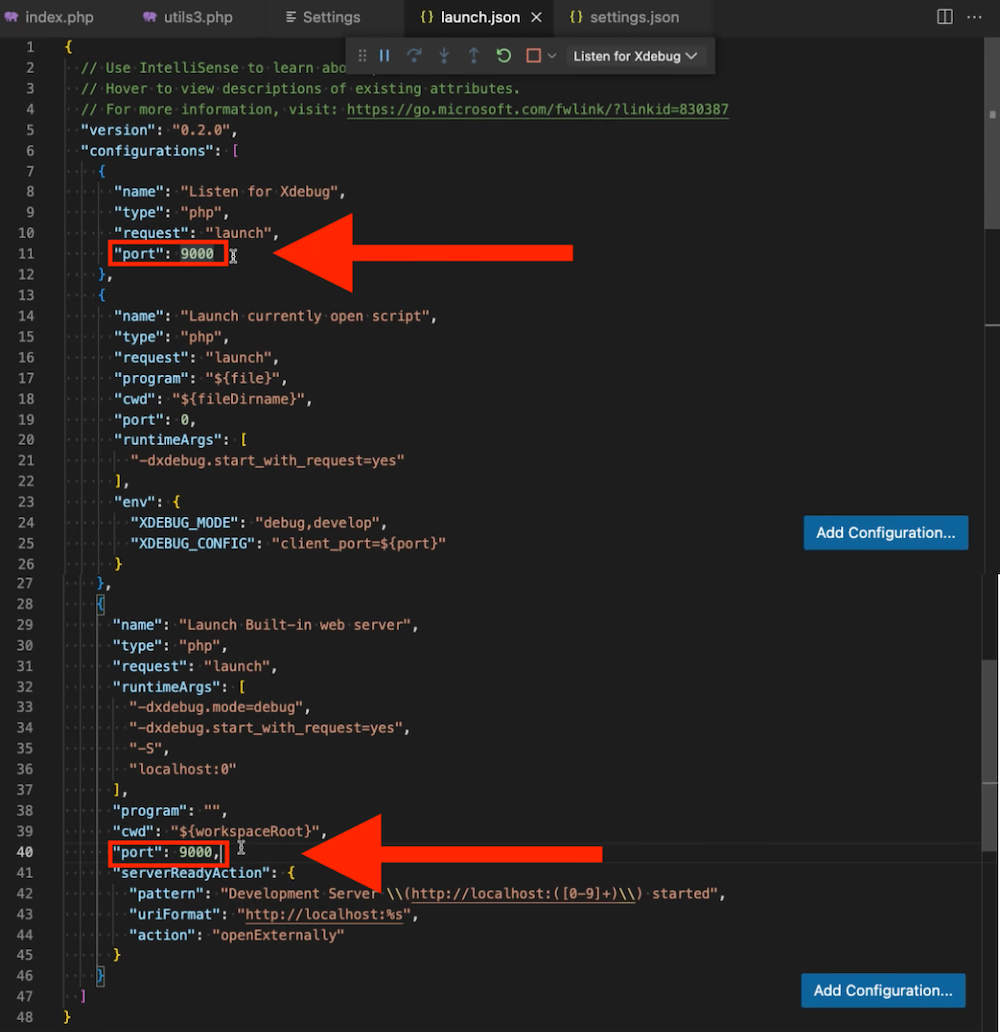
Edit the launch.json file
Now, you need to edit the port number on the file to the configured port set in the php.ini files. In our instance, we set the ports to 9000.
Note: There are two spots where the ports need to be specified.
Also, remember to save your changes.
Make debug logs display on the client browser with the error_log() command:
This step is optional but recommended.
Suppose you want to log elements from your PHP localhost onto your browser using the error_log() command (PHP). Add and save the following edits into your launch JSON file:
"externalConsole": true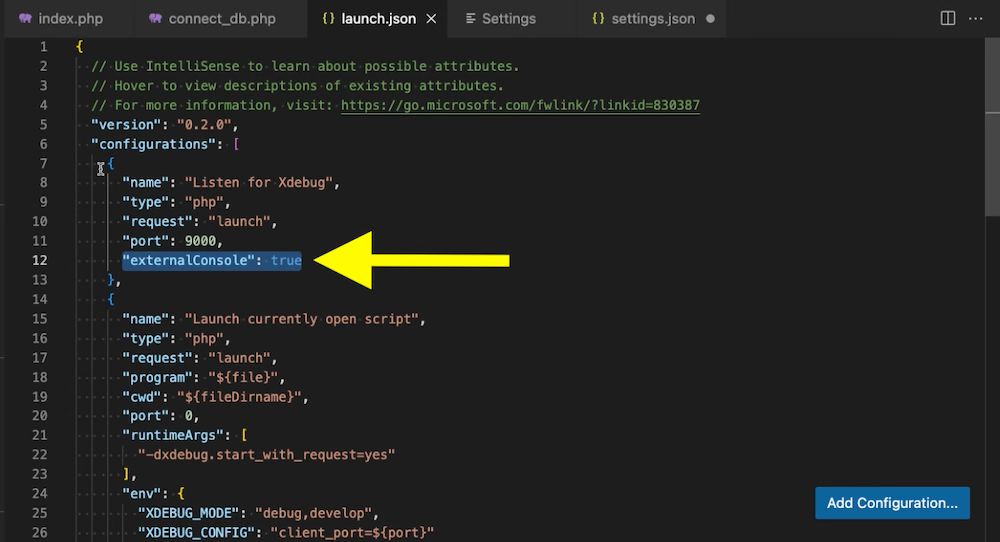
Set your Debug executable
Re-run your debugger:
- Run (top tab) > Stop Debugging
- Run (Again) > Start Debugging
VS Code will then notify you that you require a PHP Executable.
Note: An executable is the inner binary that gives VSCode debug capabilities.
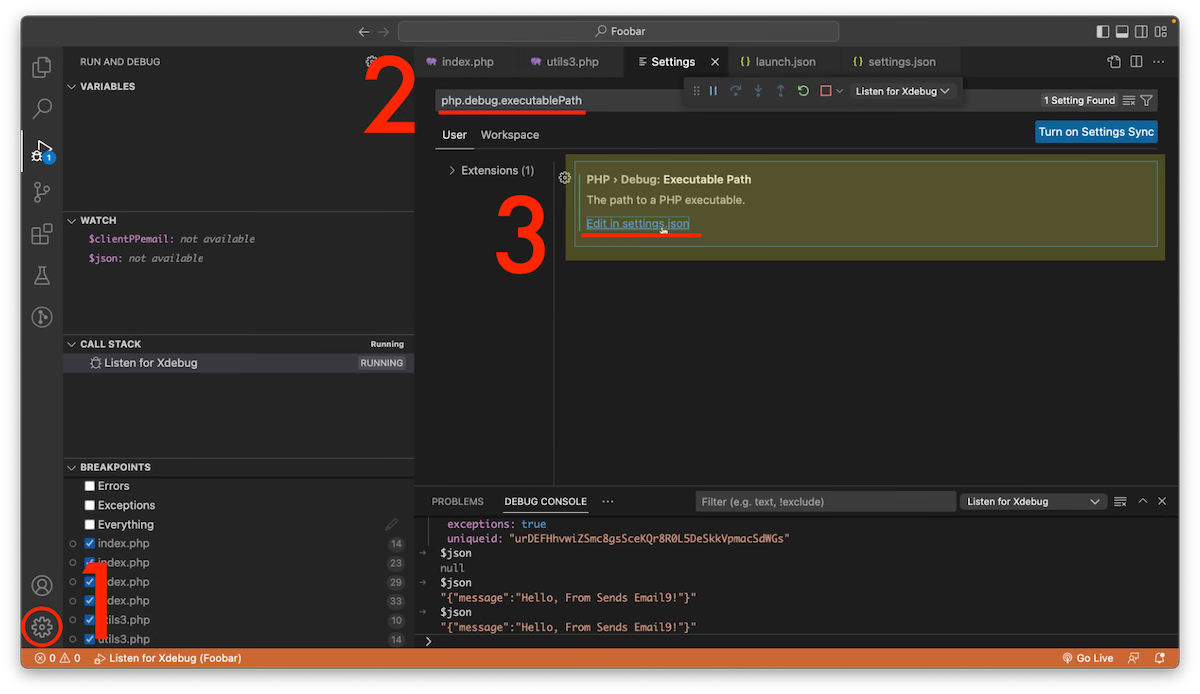
To do so, go to Settings. (Click the gear icon in the bottom left corner ⚙️ > Settings).
In the search bar of your Settings tab, write the following query:
"php.debug.executablePath"A box should appear. Click the link on it, where it is written: "Edit in settings.json"
Set your Debug executable for PHP
Within the file settings.js that pops up, you need to specify the path of your wanted debug executable.
The path may vary, but I'm 99% sure your executable will be located at:
/Applications/MAMP/bin/php/php[version]/bin/php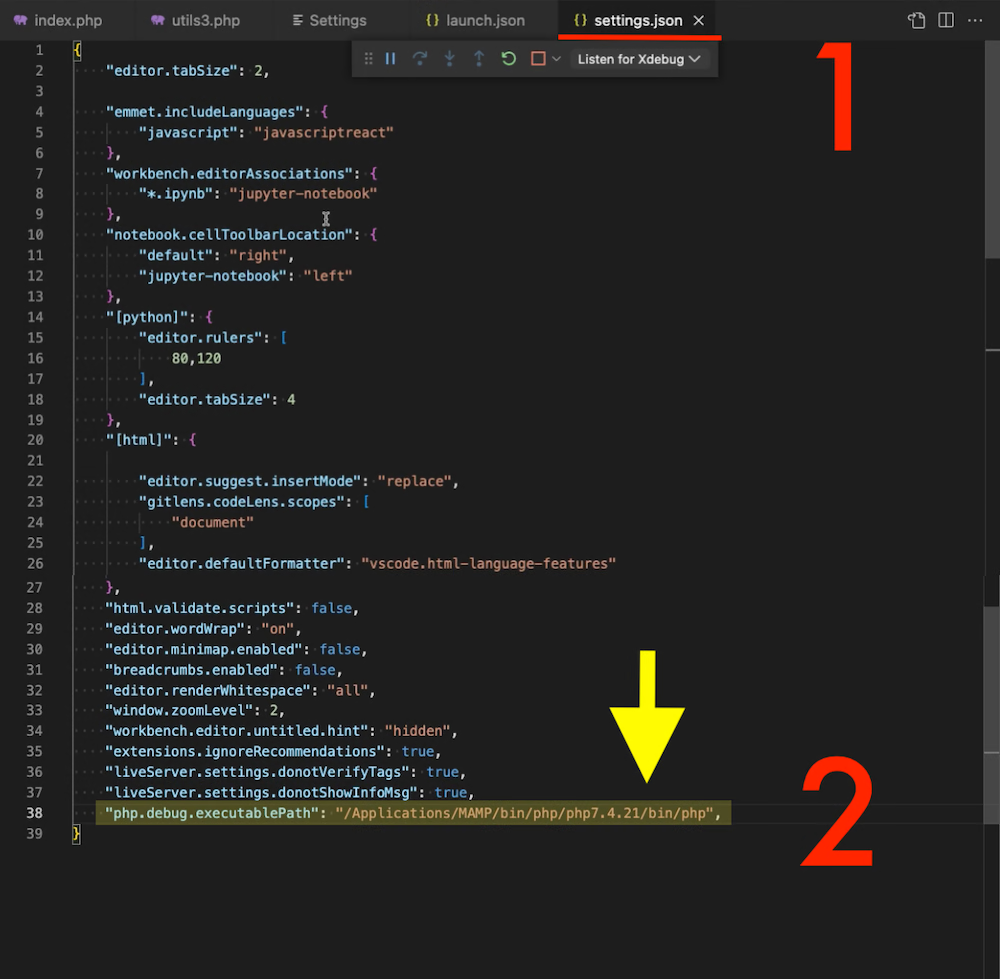
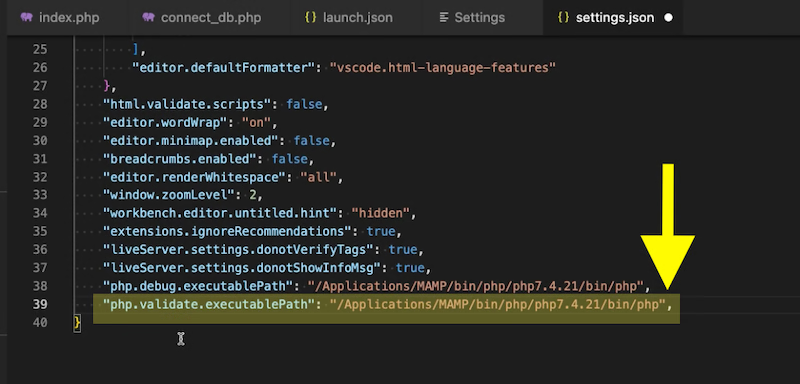
Add the same executable for validate mode
Within the file settings.js that pops up, you must specify the path of your wanted debug executable for the validate mode.The respective setting is named:
"php.validate.executablePath"To do so, add this line to your settings.json file.Note: Once added, remember to save edits.
Start Debugging
Close and relaunch VS Code: Run > Start DebuggingAt this point, XDebug should be in 'Listen mode.' You can identify if this is the case by looking at the bottom of your VS Code window, and the utmost bottom horizontal nav bar should go from blue 🔵 to orange. 🟠 At this point, XDebug should be connected to all local MAMP instances and can, therefore, "listen" to all PHP scripts you have on your local server dedicated folder:
/Applications/MAMP/htdocsYou can now place breakpoints at various code lines you wish to debug.
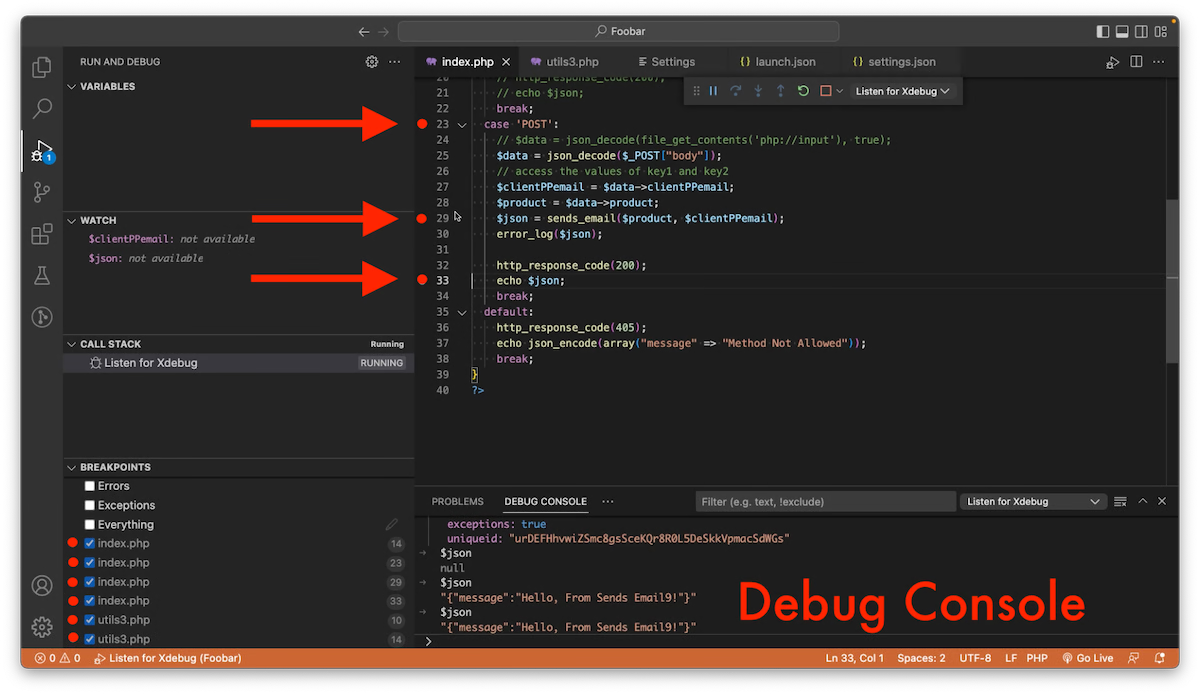
Conclusion: Run code and debug
You should now be able to run your PHP code. I ran my code to debug by requesting an HTTP to my server through Postman or the browser. My script was set to listen for GET requests, and once one was sent, the request triggered the first breakpoint, where I could then utilize the variables, watch, call stack, breakpoints, and debug console windows.
I hope this tutorial helped you.